- Breeze FSM
- 359 Comments
- 6164 Views
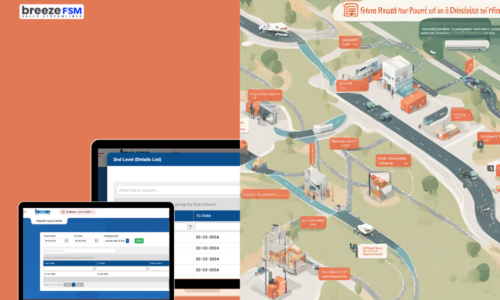
When we talk about the purpose of using a field sales management tool, one of the major reasons is we want to have a complete visualization of how our sales strategy is led through the field sales team. For the very same reason, we prefer having a real time location view on the google map of our field sales agent’s whereabouts. Thematic map provides us with a deeper visualization on showing the geographical pattern based on a particular theme or use case such as- density of your product in a certain region, the outlet coverage completed by your field sales agents.
In this article read to get thematic map information. We will make you understand why it is important and how you can leverage it for your next sales strategy.
Thematic Map Definition
If we talk about thematic maps, then thematic mapping is such a great concept that helps us visualize spatial data in such a way it displays particular themes or distinct patterns of the data. On the other hand, thematic maps do not show geographical elements such as rivers and mountains. instead they are used to visualize data according to a specific subject or characteristic.
These can be simple, like choropleth maps that color in regions or districts according to values of interest, or they can be more complex scatter plots with dots representing individual points along an x and y axis. Authorities can analyze useful relationships that exist among their data by employing thematic mapping tools.
Thematic map okay so basically thematic you should understand what different symbols, colors and patterns in the map we use to represent anything on the map like that. Simply put, creating visual representations of raw data that can be quickly and clearly understood. Thematic maps are important tools for urban planning, environmental science and market analysis among other fields of study since they enable the interested parties to make rational decisions on spatial patterns and distribution.
Decoding Product Density in the FMCG Industry through Thematic Maps.
Thematic map can be quite a tool for the FMCG sector because it can be quite insightful to know where your product is going out like hot-cakes. These maps allow you to visualize where your product is selling and how well it’s performing in those locations. With thematic maps, uncovering product density insight is fairly simple with multiple types of maps you can use.
Types of Distributional Maps
There are many types of thematic maps, here we have explain the uses and types of distributional maps:
Choropleth Maps
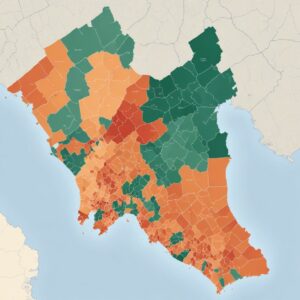
Choropleth Maps are used to analyze the product density of a particular geographical region. In these images, colors or shades show the varying sales and availability of either products in different regions.
For example, you want to have a quick glance on the regions where your new snack is selling swiftly . Using a choropleth map, we can quickly show this information represented by sales per zip code and darker colors indicating more sold. So it’s easy for you to see what areas currently love your product, and which might need a bit more marketing effort.
Dot Density Maps
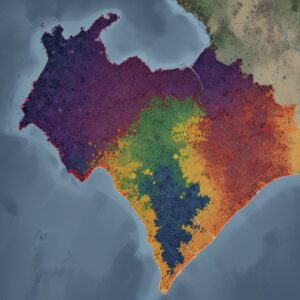
To differentiate a bit, dot density maps use dots to represent a certain number of product units sold. The more dots in an area of the map, the denser the product offering. This kind of map is very useful for finding clusters or patterns that may otherwise go unnoticed in other types of maps. You were looking at a dot density map and all of a sudden you see that there’s 20 dots on top of one particular supermarket — jackpot, your product is flying off the shelves from this store.
Heat Maps
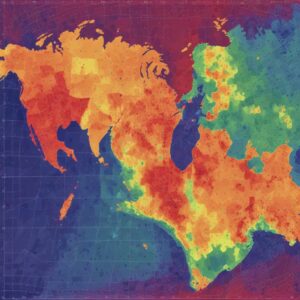
Heat maps are colored in such a way that warmer colors like red and orange represent higher densities of product than the cool-colored blue (and other shades). It generates an homogeneous picture of the distribution of a product and sometimes can be easier to understand than dividing our data in regions as it’s done in choropleth maps. Heat maps are really great ways to quickly understand where your product is working well.
Combining each of the maps with one another
Where thematic maps really shine is when you take multiple in combination with other data layers. A product density map might be an overlay of demographic data such a population or income levels to give insight into which markets may have not only a high demand for your product, but the available funds to spend on said service, etc.
Alternatively, you might incorporate data about distribution centers and transportation routes to further analyze their effects on product availability and sales. Overall, this rather comprehensive picture can be used as an instrument for making decisions on marketing and logistics.
Why Use Thematic Maps?
Visualize the product density in a map for FMCG companies to make more informed calls on where they should be selling, where they should advertise and which markets have potential. Cartographic production of thematic maps that illustrate special distinction of the product implementation and demand. The benefit of thematic maps is that the observer can visually perceive patterns, associations and discrepancies which may be hidden when analyzing simple tables of data.
Themed mapped data can be helpful to all of us from the folks running a successful snack business, to vendors pioneering personal care products. “They help you make better sense of the bigger picture which in turn allows you to draw data-driven conclusions that result in higher sales, more market share.” Next time When you are laying your business strategy down then listen to what a thematic map has to Say and let the products keep coming!
What are the advantages of maps?
More than just putting points on a map, thematic maps provide us with the ability to visually explain data.
Simplify complex information
Being able to communicate detailed nuances in an easy and digestible way is one such benefit of this format. Thematic maps are visual representations of geographic information in a form that is tailored to reflect and help understand the spatial distribution of one or more properties/variables connected with a specific theme.
Comes in various forms
It is the other big advantage of thematic maps, it can be adapted to near enough any industry/sector. With thematic maps, it is not only possible to create data visualizations based on demographic information but also prepare geographic analyses based on sales and environmental information among others. “This gives real flexibility that is invaluable for decision-making processes,” they say.
Decode the relationships and correlation between two variables
Furthermore, Thematic maps can reveal spatial patterns and relationships that are not readily apparent by raw data alone. Geographic information systems GIS facilitate the discovery of insights and intelligent decisions which are based on geographic patterns (Sewerniak et al. 16.)
Finally, and in addition to the aforementioned benefits, communication is also facilitated since thematic maps present information within a context that becomes more engaging from the perspective of other points of view (Horton 139). Visuals are always better than plain text and numbers. They make sure your main messages reach the brain more effectively
Usage of Thematic Maps in Field Sales
Thematic maps are important technologies for field sales industry as it helps to create a visual data output which enables the field sales team to take decisions from insights. If sales data can be overlayed onto a map businesses may recognise trends and patterns in their data that they don’t initially see when face with a sheet full of numbers.
Thematic maps are one way field sales teams can take a look at the demographics of their customers in various regions. One of the biggest advantages to mapping out where this mobile target audience is, then companies can optimize all marketing strategies targeting certain locations according to factors such as age group, revenue level/emd or how consumer behaves.
Thematic maps further enable field sales reps to plan their routes through the display of regions with the most significant potential for more opportunities. “This approach allows our representatives to cover more ground, maximizing the time they spend interacting with customers,” he adds.
Thematic maps also allow businesses to monitor the location of competitors within arch region where they hold market share. With this information at their disposal, sales teams can adapt their messaging as needed and remain a step ahead of competitors in an increasingly volatile and fast-paced market.
Bring Clarity in Sales Strategy with Thematic Maps
A thematic map is a powerful tool that can provide great insight into spatial data by representing it visually. This opens up a host of possibilities for industries, where thematic mapping can help them identify patterns and trends, to enable them to make decisions with better insight into potential outcomes. FMCG brands can gain great advantage by leveraging thematic maps in India to understand the complex market and volatile customer preference, their benefits and identify their role in field sales to make a potential path to success using the same technology.
The use of thematic maps has the power to transform how businesses use and analyze data, convey information through visualizations, and chart a course for maneuvering these insights. With the evolution of technology, thematic mapping is poised to grow in importance for organizations wanting to maintain a competitive advantage. If you want to know how you can integrate thematic maps in your field sales management tool, contact our experts today!



BrianWes
farmacie online affidabili: farmacie online affidabili – farmacia online
п»їFarmacia online migliore
Briandix
acquisto farmaci con ricetta https://farmaprodotti.com/# Farmacie on line spedizione gratuita
acquisto farmaci con ricetta
Clintknipt
http://farmabrufen.com/# BRUFEN prezzo
farmacia online senza ricetta
Davidvaf
http://winchile.pro/# La mГєsica acompaГ±a la experiencia de juego.
The Philippines has several world-class integrated resorts.
PatrickLef
Many casinos host charity events and fundraisers.: taya365 – taya365
JosephWaina
phtaya [url=https://phtaya.tech/#]phtaya login[/url] The casino scene is constantly evolving.
Lannycerse
Security measures ensure a safe environment.: taya777.icu – taya777 register login
Davidvaf
http://taya365.art/# Gaming regulations are overseen by PAGCOR.
Many casinos offer luxurious amenities and services.
Davidvaf
http://taya777.icu/# Casinos often host special holiday promotions.
Slot machines attract players with big jackpots.
PatrickLef
High rollers receive exclusive treatment and bonuses.: phmacao – phmacao club
Lannycerse
Los croupiers son amables y profesionales.: jugabet – jugabet
Williamaccot
The casino atmosphere is thrilling and energetic. https://taya365.art/# The casino scene is constantly evolving.
JosephWaina
taya365 [url=https://taya365.art/#]taya365.art[/url] Promotions are advertised through social media channels.
Davidvaf
https://winchile.pro/# Los jugadores deben jugar con responsabilidad.
Loyalty programs reward regular customers generously.
PatrickLef
Algunos casinos tienen programas de recompensas.: win chile – winchile casino
Lannycerse
Los pagos son rГЎpidos y seguros.: jugabet chile – jugabet.xyz
Williamaccot
High rollers receive exclusive treatment and bonuses. http://phtaya.tech/# A variety of gaming options cater to everyone.
Davidvaf
https://jugabet.xyz/# Los bonos de bienvenida son generosos.
The Philippines has a vibrant nightlife scene.
PatrickLef
Live music events often accompany gaming nights.: taya777 – taya777.icu
Lannycerse
Los juegos en vivo ofrecen emociГіn adicional.: winchile – win chile
Davidvaf
http://winchile.pro/# Los casinos ofrecen entretenimiento en vivo.
Poker rooms host exciting tournaments regularly.
Williamaccot
The poker community is very active here. https://phmacao.life/# Slot tournaments create friendly competitions among players.
JosephWaina
jugabet casino [url=https://jugabet.xyz/#]jugabet[/url] La ruleta es un juego emocionante aquГ.
Lannycerse
Entertainment shows are common in casinos.: taya777 register login – taya777 register login
PatrickLef
The gaming floors are always bustling with excitement.: taya365 com login – taya365
Davidvaf
http://taya777.icu/# Entertainment shows are common in casinos.
Many casinos provide shuttle services for guests.
Williamaccot
п»їCasinos in the Philippines are highly popular. http://phmacao.life/# Many casinos host charity events and fundraisers.
Davidvaf
http://taya365.art/# Cashless gaming options are becoming popular.
Slot machines attract players with big jackpots.
Lannycerse
High rollers receive exclusive treatment and bonuses.: taya777 login – taya777 app
PatrickLef
La mГєsica acompaГ±a la experiencia de juego.: winchile.pro – win chile
JosephWaina
phtaya [url=https://phtaya.tech/#]phtaya.tech[/url] Security measures ensure a safe environment.
Williamaccot
Gaming regulations are overseen by PAGCOR. https://jugabet.xyz/# La Г©tica del juego es esencial.
Davidvaf
https://phmacao.life/# The casino experience is memorable and unique.
The Philippines has a vibrant nightlife scene.
Lannycerse
Casinos often host special holiday promotions.: taya365.art – taya365 login
Williamaccot
Loyalty programs reward regular customers generously. http://phmacao.life/# Casino promotions draw in new players frequently.
Davidvaf
http://phtaya.tech/# Many casinos provide shuttle services for guests.
The casino atmosphere is thrilling and energetic.
JosephWaina
phmacao club [url=http://phmacao.life/#]phmacao[/url] Cashless gaming options are becoming popular.
Lannycerse
Gaming regulations are overseen by PAGCOR.: taya365 com login – taya365 login
PatrickLef
La mayorГa acepta monedas locales y extranjeras.: win chile – winchile.pro
Davidvaf
https://taya365.art/# Many casinos provide shuttle services for guests.
The casino experience is memorable and unique.
Williamaccot
Casino visits are a popular tourist attraction. https://jugabet.xyz/# Es comГєn ver jugadores sociales en mesas.
Lannycerse
The casino atmosphere is thrilling and energetic.: taya777 register login – taya777.icu
Davidvaf
https://taya777.icu/# Players can enjoy high-stakes betting options.
Slot machines attract players with big jackpots.
PatrickLef
Live music events often accompany gaming nights.: phmacao com – phmacao
Williamaccot
Casino promotions draw in new players frequently. http://taya777.icu/# Game rules can vary between casinos.
JosephWaina
phtaya login [url=http://phtaya.tech/#]phtaya.tech[/url] The thrill of winning keeps players engaged.
Davidvaf
https://taya365.art/# The ambiance is designed to excite players.
Poker rooms host exciting tournaments regularly.
Lannycerse
Los jackpots progresivos atraen a los jugadores.: jugabet chile – jugabet casino
PatrickLef
Los juegos de mesa son clГЎsicos eternos.: jugabet – jugabet.xyz
Davidvaf
http://taya365.art/# Responsible gaming initiatives are promoted actively.
Many casinos host charity events and fundraisers.
Lannycerse
Casino visits are a popular tourist attraction.: phmacao casino – phmacao.life
PatrickLef
La Г©tica del juego es esencial.: jugabet chile – jugabet
Davidvaf
http://phmacao.life/# Players must be at least 21 years old.
The Philippines offers a rich gaming culture.
JosephWaina
taya777 register login [url=http://taya777.icu/#]taya777 login[/url] The casino scene is constantly evolving.
Lannycerse
Visitors come from around the world to play.: phtaya.tech – phtaya casino
PatrickLef
Hay casinos en Santiago y ViГ±a del Mar.: winchile – winchile casino
Davidvaf
https://jugabet.xyz/# Los pagos son rГЎpidos y seguros.
Many casinos host charity events and fundraisers.
Lannycerse
The thrill of winning keeps players engaged.: phtaya.tech – phtaya login
Davidvaf
https://winchile.pro/# La iluminaciГіn crea un ambiente vibrante.
Some casinos have luxurious spa facilities.
PatrickLef
Many casinos host charity events and fundraisers.: phtaya.tech – phtaya
JosephWaina
taya365 login [url=http://taya365.art/#]taya365[/url] Most casinos offer convenient transportation options.
Williamaccot
Casinos often host special holiday promotions. https://phtaya.tech/# The poker community is very active here.
Lannycerse
п»їCasinos in the Philippines are highly popular.: taya365.art – taya365
Davidvaf
https://winchile.pro/# Las ganancias son una gran motivaciГіn.
Many casinos offer luxurious amenities and services.
PatrickLef
Slot machines feature various exciting themes.: phtaya.tech – phtaya casino
Davidvaf
http://taya365.art/# Entertainment shows are common in casinos.
The gaming floors are always bustling with excitement.
Lannycerse
Gaming regulations are overseen by PAGCOR.: taya365 com login – taya365.art
PatrickLef
Gaming regulations are overseen by PAGCOR.: phtaya.tech – phtaya
Davidvaf
http://phtaya.tech/# Game rules can vary between casinos.
Many casinos offer luxurious amenities and services.
Lannycerse
Las redes sociales promocionan eventos de casinos.: jugabet chile – jugabet casino
Davidvaf
https://taya365.art/# The casino atmosphere is thrilling and energetic.
Poker rooms host exciting tournaments regularly.
PatrickLef
Las estrategias son clave en los juegos.: jugabet chile – jugabet casino
Lannycerse
The poker community is very active here.: phmacao club – phmacao.life
Williamaccot
Manila is home to many large casinos. https://phmacao.life/# п»їCasinos in the Philippines are highly popular.
Davidvaf
https://phmacao.life/# Gambling regulations are strictly enforced in casinos.
Responsible gaming initiatives are promoted actively.
JosephWaina
phmacao [url=https://phmacao.life/#]phmacao club[/url] Casinos often host special holiday promotions.
PatrickLef
The casino atmosphere is thrilling and energetic.: phtaya casino – phtaya.tech
Lannycerse
Las apuestas deportivas tambiГ©n son populares.: win chile – winchile casino
Davidvaf
http://phtaya.tech/# The Philippines has several world-class integrated resorts.
Casinos often host special holiday promotions.
PatrickLef
п»їCasinos in the Philippines are highly popular.: taya365 – taya365 login
Davidvaf
http://jugabet.xyz/# Las tragamonedas ofrecen grandes premios.
Players must be at least 21 years old.
Lannycerse
Players enjoy both fun and excitement in casinos.: phtaya casino – phtaya login
JosephWaina
taya365 login [url=https://taya365.art/#]taya365.art[/url] Manila is home to many large casinos.
PatrickLef
Players must be at least 21 years old.: phmacao.life – phmacao casino
Davidvaf
https://taya365.art/# The poker community is very active here.
The casino atmosphere is thrilling and energetic.
Williamaccot
Gambling regulations are strictly enforced in casinos. https://taya777.icu/# Many casinos provide shuttle services for guests.
Lannycerse
La iluminaciГіn crea un ambiente vibrante.: jugabet.xyz – jugabet chile
Davidvaf
http://taya365.art/# Resorts provide both gaming and relaxation options.
Players can enjoy high-stakes betting options.
Michaelglype
mail order pharmacy no prescription https://familypharmacy.company/# canadian pharmacy no prescription needed
Charlestex
pharmacy coupons http://megaindiapharm.com/# Mega India Pharm
Portereluts
easy canadian pharm [url=http://easycanadianpharm.com/#]canadian pharmacy uk delivery[/url] easy canadian pharm
Davidgeddy
easy canadian pharm: easy canadian pharm – canadian drugs online
WillieInilm
best canadian pharmacy: easy canadian pharm – pharmacy wholesalers canada
Michaelglype
buying prescription drugs from canada http://familypharmacy.company/# canadian pharmacy no prescription needed
Charlestex
best online pharmacy no prescription https://easycanadianpharm.shop/# easy canadian pharm
Michaelglype
canadian pharmacy world coupon https://megaindiapharm.com/# Mega India Pharm
Davidgeddy
easy canadian pharm: thecanadianpharmacy – easy canadian pharm
WillieInilm
easy canadian pharm: canadian pharmacy oxycodone – canadian pharmacy prices
Charlestex
canadian pharmacy coupon code https://discountdrugmart.pro/# discount drugs
Michaelglype
cheapest pharmacy to fill prescriptions without insurance https://easycanadianpharm.com/# best canadian pharmacy to buy from
Davidgeddy
easy canadian pharm: certified canadian pharmacy – easy canadian pharm
WillieInilm
MegaIndiaPharm: india pharmacy mail order – indian pharmacy
Charlestex
no prescription needed pharmacy https://easycanadianpharm.com/# canadianpharmacyworld
WillieInilm
easy canadian pharm: canadian pharmacy 24 – canadian pharmacy world
Davidgeddy
canadian medications: reliable canadian pharmacy – canadian world pharmacy
Portereluts
buying prescription drugs in mexico online [url=https://xxlmexicanpharm.com/#]purple pharmacy mexico price list[/url] xxl mexican pharm
Charlestex
best online pharmacy no prescription https://megaindiapharm.shop/# Mega India Pharm
WillieInilm
MegaIndiaPharm: top online pharmacy india – MegaIndiaPharm
Davidgeddy
mexican rx online: mexico drug stores pharmacies – xxl mexican pharm
Michaelglype
canadian pharmacy coupon code http://discountdrugmart.pro/# discount drugs
Charlestex
legit non prescription pharmacies http://xxlmexicanpharm.com/# mexican mail order pharmacies
WillieInilm
xxl mexican pharm: xxl mexican pharm – xxl mexican pharm
Michaelglype
cheapest prescription pharmacy http://easycanadianpharm.com/# easy canadian pharm
Davidgeddy
buying prescription drugs in mexico: xxl mexican pharm – xxl mexican pharm
Portereluts
Mega India Pharm [url=https://megaindiapharm.com/#]MegaIndiaPharm[/url] indian pharmacies safe
Charlestex
canada pharmacy coupon https://easycanadianpharm.com/# is canadian pharmacy legit
Michaelglype
cheapest pharmacy to fill prescriptions with insurance https://megaindiapharm.com/# MegaIndiaPharm
WillieInilm
Mega India Pharm: MegaIndiaPharm – indian pharmacy paypal
Davidgeddy
online shopping pharmacy india: buy medicines online in india – MegaIndiaPharm
Michaelglype
cheapest prescription pharmacy https://familypharmacy.company/# online pharmacy delivery usa
Charlestex
canadian pharmacy no prescription needed https://easycanadianpharm.com/# canadian drug pharmacy
WillieInilm
easy canadian pharm: easy canadian pharm – easy canadian pharm
Michaelglype
cheapest pharmacy to fill prescriptions without insurance https://familypharmacy.company/# Best online pharmacy
Portereluts
Best online pharmacy [url=https://familypharmacy.company/#]Online pharmacy USA[/url] online pharmacy delivery usa
Davidgeddy
xxl mexican pharm: mexican pharmaceuticals online – mexico drug stores pharmacies
Charlestex
online pharmacy no prescription http://megaindiapharm.com/# Online medicine home delivery
Michaelglype
rx pharmacy no prescription http://discountdrugmart.pro/# discount drug mart pharmacy
WillieInilm
xxl mexican pharm: xxl mexican pharm – mexican drugstore online
Davidgeddy
easy canadian pharm: easy canadian pharm – northern pharmacy canada
Michaelglype
online pharmacy prescription https://xxlmexicanpharm.com/# mexican rx online
Charlestex
canadian pharmacies not requiring prescription http://easycanadianpharm.com/# canadian pharmacy ltd
WillieInilm
mexican online pharmacies prescription drugs: mexico drug stores pharmacies – best online pharmacies in mexico
Portereluts
medication from mexico pharmacy [url=https://xxlmexicanpharm.com/#]xxl mexican pharm[/url] xxl mexican pharm
Michaelglype
us pharmacy no prescription http://discountdrugmart.pro/# drugmart
Davidgeddy
Mega India Pharm: MegaIndiaPharm – Mega India Pharm
Charlestex
rx pharmacy no prescription https://xxlmexicanpharm.shop/# medication from mexico pharmacy
WillieInilm
reputable indian online pharmacy: Mega India Pharm – MegaIndiaPharm
Davidgeddy
discount drugs: discount drug pharmacy – drug mart
Charlestex
rx pharmacy coupons http://discountdrugmart.pro/# drug mart
Michaelglype
cheapest prescription pharmacy http://discountdrugmart.pro/# uk pharmacy no prescription
Portereluts
xxl mexican pharm [url=https://xxlmexicanpharm.shop/#]xxl mexican pharm[/url] medicine in mexico pharmacies
WillieInilm
xxl mexican pharm: xxl mexican pharm – purple pharmacy mexico price list
Davidgeddy
easy canadian pharm: easy canadian pharm – easy canadian pharm
Michaelglype
reputable online pharmacy no prescription https://easycanadianpharm.shop/# easy canadian pharm
Charlestex
online pharmacy discount code https://familypharmacy.company/# Online pharmacy USA
WillieInilm
medicine in mexico pharmacies: pharmacies in mexico that ship to usa – xxl mexican pharm
Michaelglype
canadian pharmacy world coupon https://megaindiapharm.shop/# MegaIndiaPharm
Davidgeddy
Mega India Pharm: india online pharmacy – india online pharmacy
Charlestex
no prescription needed pharmacy http://discountdrugmart.pro/# drug mart
Portereluts
drugmart [url=https://discountdrugmart.pro/#]discount drug mart pharmacy[/url] drugmart
WillieInilm
family pharmacy: online pharmacy delivery usa – online pharmacy delivery usa
Michaelglype
canadian pharmacy world coupon code https://xxlmexicanpharm.com/# buying prescription drugs in mexico
Charlestex
prescription drugs online https://xxlmexicanpharm.shop/# п»їbest mexican online pharmacies
Davidgeddy
canadian king pharmacy: canadian pharmacy price checker – canadian drugs
Michaelglype
online pharmacy discount code https://xxlmexicanpharm.com/# mexico pharmacies prescription drugs
WillieInilm
Cheapest online pharmacy: online pharmacy delivery usa – online pharmacy delivery usa
Portereluts
Best online pharmacy [url=https://familypharmacy.company/#]family pharmacy[/url] canadian pharmacy discount code
Michaelglype
cheapest pharmacy to fill prescriptions without insurance https://xxlmexicanpharm.shop/# medication from mexico pharmacy
Charlestex
canada online pharmacy no prescription https://xxlmexicanpharm.shop/# mexican rx online
Davidgeddy
Cheapest online pharmacy: online pharmacy delivery usa – Online pharmacy USA
WillieInilm
п»їbest mexican online pharmacies: xxl mexican pharm – mexico drug stores pharmacies
Charlestex
canada pharmacy not requiring prescription https://discountdrugmart.pro/# drug mart
Davidgeddy
easy canadian pharm: my canadian pharmacy – canadian pharmacy victoza
WillieInilm
Mega India Pharm: MegaIndiaPharm – world pharmacy india
Michaelglype
cheapest pharmacy for prescriptions without insurance http://discountdrugmart.pro/# drug mart
Charlestex
uk pharmacy no prescription https://megaindiapharm.shop/# Mega India Pharm
Davidgeddy
Mega India Pharm: indian pharmacy – Online medicine order
Michaelglype
pharmacy without prescription https://discountdrugmart.pro/# discount drug mart
berita dana
UID_74743238###
Ini dia! 🎉🎉 ASN BKN Ubah Pola Kerja yang baru dan efisien! 🎉🎉.
Charlestex
pharmacy discount coupons https://megaindiapharm.com/# Mega India Pharm
Davidgeddy
easy canadian pharm: easy canadian pharm – canadian pharmacy 1 internet online drugstore
Michaelglype
cheapest pharmacy for prescriptions https://easycanadianpharm.com/# easy canadian pharm
Charlestex
canadian pharmacy world coupon http://megaindiapharm.com/# Mega India Pharm
Portereluts
canada pharmacy reviews [url=https://easycanadianpharm.com/#]canadian family pharmacy[/url] easy canadian pharm
Michaelglype
canadian pharmacies not requiring prescription https://discountdrugmart.pro/# discount drug pharmacy
berita dana
UID_74743238###
Ini dia! 🎉🎉 ASN BKN Ubah Pola Kerja yang baru dan efisien! 🎉🎉.
Davidgeddy
MegaIndiaPharm: MegaIndiaPharm – MegaIndiaPharm
Charlestex
buying prescription drugs from canada https://xxlmexicanpharm.com/# best online pharmacies in mexico
Michaelglype
pharmacy without prescription https://easycanadianpharm.com/# easy canadian pharm
Davidgeddy
online pharmacy delivery usa: Best online pharmacy – pharmacy coupons
berita dana
UID_83344528###
Inilah 🎉🎉 Pupuk Inovatif Kebun Riset Kujang yang bikin Wamen BUMN bangga! 💪🏻🇮🇩
WillieJes
Mesin slot sering diperbarui dengan game baru http://bonaslot.site/# Keseruan bermain slot selalu menggoda para pemain
Jamesbrota
Banyak pemain mencari mesin dengan RTP tinggi http://preman69.tech/# Mesin slot dapat dimainkan dalam berbagai bahasa
Aaronron
BonaSlot [url=https://bonaslot.site/#]bonaslot[/url] Bermain slot bisa menjadi pengalaman sosial
Davidacamb
https://slotdemo.auction/# п»їKasino di Indonesia sangat populer di kalangan wisatawan
ThomasMop
Kasino mendukung permainan bertanggung jawab: preman69 slot – preman69 slot
Jamesbrota
Kasino menawarkan pengalaman bermain yang seru http://slotdemo.auction/# Pemain sering mencoba berbagai jenis slot
Davidacamb
https://garuda888.top/# Mesin slot dapat dimainkan dalam berbagai bahasa
ThomasMop
Pemain sering mencoba berbagai jenis slot: slot demo pg gratis – akun demo slot
WillieJes
Pemain harus menetapkan batas saat bermain http://slotdemo.auction/# Banyak kasino menawarkan permainan langsung yang seru
Aaronron
preman69 [url=https://preman69.tech/#]preman69 slot[/url] п»їKasino di Indonesia sangat populer di kalangan wisatawan
Davidacamb
https://garuda888.top/# Kasino memiliki suasana yang energik dan menyenangkan
Jamesbrota
Slot dengan tema budaya lokal menarik perhatian https://bonaslot.site/# Permainan slot bisa dimainkan dengan berbagai taruhan
ThomasMop
Kasino memastikan keamanan para pemain dengan baik: garuda888 slot – garuda888.top
WillieJes
Permainan slot mudah dipahami dan menyenangkan https://garuda888.top/# Slot menawarkan berbagai jenis permainan bonus
Davidacamb
http://bonaslot.site/# Pemain sering berbagi tips untuk menang
ThomasMop
Kasino memiliki suasana yang energik dan menyenangkan: slot demo gratis – slot demo
WillieJes
Kasino di Jakarta memiliki berbagai pilihan permainan https://slotdemo.auction/# Kasino di Indonesia menyediakan hiburan yang beragam
Aaronron
slot88.company [url=http://slot88.company/#]slot88.company[/url] Permainan slot bisa dimainkan dengan berbagai taruhan
Davidacamb
https://slotdemo.auction/# Slot dengan fitur interaktif semakin banyak tersedia
ThomasMop
Pemain sering mencoba berbagai jenis slot: bonaslot – bonaslot
WillieJes
Kasino sering mengadakan turnamen slot menarik http://garuda888.top/# Slot memberikan kesempatan untuk menang besar
Jamesbrota
Beberapa kasino memiliki area khusus untuk slot http://slot88.company/# Slot dengan tema film terkenal menarik banyak perhatian
Davidacamb
https://preman69.tech/# Banyak pemain menikmati bermain slot secara online
WillieJes
Banyak pemain mencari mesin dengan RTP tinggi http://slotdemo.auction/# Banyak kasino menawarkan permainan langsung yang seru
ThomasMop
Jackpot progresif menarik banyak pemain: garuda888.top – garuda888 slot
Aaronron
garuda888.top [url=https://garuda888.top/#]garuda888.top[/url] Slot modern memiliki grafik yang mengesankan
slot gacor agentotoplay
UID_25978847###
situs terbaik hanya di slot gacor agentotoplay
WillieJes
Slot modern memiliki grafik yang mengesankan http://slotdemo.auction/# Kasino mendukung permainan bertanggung jawab
Davidacamb
http://slot88.company/# Pemain bisa menikmati slot dari kenyamanan rumah
ThomasMop
Slot dengan bonus putaran gratis sangat populer: slotdemo – akun demo slot
slot gacor agentotoplay
UID_95859078###
Baru-baru ini, para pemain Mahjong Wins 3 dikejutkan dengan bocoran RTP yang diklaim bisa meningkatkan peluang kemenangan secara signifikan. Banyak yang percaya bahwa informasi ini membantu mereka mendapatkan hasil yang lebih konsisten dalam permainan. Jika Anda ingin tahu lebih lanjut, cek bocoran RTP Mahjong Wins 3 hari ini dan lihat apakah strategi ini benar-benar efektif.
WillieJes
Kasino sering mengadakan turnamen slot menarik https://slotdemo.auction/# Banyak pemain mencari mesin dengan RTP tinggi
Davidacamb
http://slotdemo.auction/# Slot modern memiliki grafik yang mengesankan
ThomasMop
Kasino menyediakan layanan pelanggan yang baik: slot88 – slot 88
Aaronron
slot 88 [url=http://slot88.company/#]slot88.company[/url] Banyak kasino memiliki promosi untuk slot
WillieJes
Slot memberikan kesempatan untuk menang besar http://preman69.tech/# Slot menjadi bagian penting dari industri kasino
Davidacamb
http://garuda888.top/# Slot klasik tetap menjadi favorit banyak orang
ThomasMop
Banyak kasino menawarkan permainan langsung yang seru: garuda888.top – garuda888 slot
WillieJes
Slot klasik tetap menjadi favorit banyak orang https://bonaslot.site/# Slot menawarkan berbagai jenis permainan bonus
Davidacamb
http://garuda888.top/# Kasino menawarkan pengalaman bermain yang seru
WillieJes
Banyak pemain menikmati bermain slot secara online https://garuda888.top/# Kasino selalu memperbarui mesin slotnya
slot gacor agentotoplay
UID_57331425###
Skandal terbaru mengguncang komunitas pecinta game slot setelah seorang admin terkenal, Rachel, dikabarkan tertangkap membocorkan pola kemenangan Gate of Olympus. Banyak yang bertanya-tanya apakah informasi ini benar-benar akurat atau hanya sekadar rumor yang beredar di kalangan pemain. Simak lebih lanjut detailnya dalam artikel admin Rachel tertangkap bocorkan pola Gate of Olympus.
ThomasMop
Slot dengan tema film terkenal menarik banyak perhatian: bonaslot – bonaslot.site
Aaronron
preman69 [url=https://preman69.tech/#]preman69[/url] Banyak kasino memiliki promosi untuk slot
Davidacamb
https://slotdemo.auction/# Kasino mendukung permainan bertanggung jawab
WillieJes
Kasino sering mengadakan turnamen slot menarik http://slotdemo.auction/# Kasino di Indonesia menyediakan hiburan yang beragam
ThomasMop
Slot dengan bonus putaran gratis sangat populer: preman69 slot – preman69
WillieJes
Kasino selalu memperbarui mesin slotnya https://garuda888.top/# Kasino selalu memperbarui mesin slotnya
ThomasMop
Slot menawarkan berbagai jenis permainan bonus: slot 88 – slot 88
WillieJes
Beberapa kasino memiliki area khusus untuk slot https://preman69.tech/# Pemain harus memahami aturan masing-masing mesin
slot gacor agentotoplay
UID_17136916###
Kisah inspiratif datang dari seorang tukang ojek online asal Tangerang yang berhasil membawa pulang hadiah fantastis setelah bermain Mahjong Ways 2. Dengan modal kecil, ia sukses mengubah nasibnya dan meraih kemenangan besar senilai 200 juta rupiah. Penasaran bagaimana caranya? Simak kisah lengkapnya di artikel tukang ojek online menang 200 juta dari Mahjong Ways 2.
ThomasMop
Slot menjadi daya tarik utama di kasino: preman69 – preman69
WillieJes
Bermain slot bisa menjadi pengalaman sosial https://slot88.company/# Pemain harus memahami aturan masing-masing mesin
Davidacamb
http://bonaslot.site/# Kasino selalu memperbarui mesin slotnya
slot gacor agentotoplay
UID_87427935###
Cek yuk! 🚍👮♂️Operasi Keselamatan 2025 Polres Ciamis Siapa tahu bus favoritmu jadi sasaran! 😱👍
ThomasMop
Kasino memastikan keamanan para pemain dengan baik: preman69 slot – preman69 slot
WillieJes
Mesin slot sering diperbarui dengan game baru http://slot88.company/# Banyak pemain mencari mesin dengan RTP tinggi
Davidacamb
http://garuda888.top/# Pemain sering mencoba berbagai jenis slot
Aaronron
garuda888.top [url=https://garuda888.top/#]garuda888 slot[/url] Kasino di Bali menarik banyak pengunjung
ThomasMop
Jackpot besar bisa mengubah hidup seseorang: slot demo – slot demo
WillieJes
Keseruan bermain slot selalu menggoda para pemain http://bonaslot.site/# Pemain harus menetapkan batas saat bermain
Davidacamb
https://garuda888.top/# Kasino di Indonesia menyediakan hiburan yang beragam
WillieJes
Banyak kasino memiliki promosi untuk slot http://preman69.tech/# Permainan slot mudah dipahami dan menyenangkan
ThomasMop
п»їKasino di Indonesia sangat populer di kalangan wisatawan: slot88.company – slot88.company
Davidacamb
https://preman69.tech/# Slot dengan bonus putaran gratis sangat populer
slot gacor agentotoplay
UID_18563832###
Ini yang di ganti >>> Yuk, ketahui lebih lanjut tentang Syarat Gabung OECD dan Pentingnya Ratifikasi Konvensi Antisuap di sini! 🕵️♀️🔎📚.
WillieJes
Kasino menawarkan pengalaman bermain yang seru https://slot88.company/# Mesin slot menawarkan pengalaman bermain yang cepat
ThomasMop
Banyak kasino menawarkan permainan langsung yang seru: BonaSlot – BonaSlot
Aaronron
bonaslot.site [url=https://bonaslot.site/#]bonaslot[/url] Kasino sering mengadakan turnamen slot menarik
Davidacamb
http://preman69.tech/# Slot menawarkan berbagai jenis permainan bonus
ThomasMop
Slot menjadi daya tarik utama di kasino: preman69 – preman69
Davidacamb
https://slotdemo.auction/# Banyak pemain menikmati jackpot harian di slot
WillieJes
Bermain slot bisa menjadi pengalaman sosial http://slot88.company/# Slot dengan tema budaya lokal menarik perhatian
slot gacor agentotoplay
UID_83003169###
Kenalan yuk! 🤝 Dengan guru inspiratif ini, Guru Dede Sulaeman yang mengajarkan cara merapikan pakaian di kelasnya. 👕👚🎓
Davidacamb
http://bonaslot.site/# Jackpot besar bisa mengubah hidup seseorang
Jamesbrota
Banyak pemain berusaha untuk mendapatkan jackpot https://slotdemo.auction/# Banyak pemain berusaha untuk mendapatkan jackpot
Aaronron
bonaslot.site [url=https://bonaslot.site/#]bonaslot.site[/url] Slot menjadi daya tarik utama di kasino
WillieJes
Slot menjadi bagian penting dari industri kasino https://slotdemo.auction/# Pemain bisa menikmati slot dari kenyamanan rumah
ThomasMop
Kasino sering mengadakan turnamen slot menarik: garuda888 slot – garuda888 slot
WillieJes
Kasino di Jakarta memiliki berbagai pilihan permainan http://garuda888.top/# Kasino sering mengadakan turnamen slot menarik
Davidacamb
http://slotdemo.auction/# Banyak pemain menikmati bermain slot secara online
Jamesbrota
Keseruan bermain slot selalu menggoda para pemain http://slot88.company/# Kasino di Jakarta memiliki berbagai pilihan permainan
WillieJes
Mesin slot sering diperbarui dengan game baru https://preman69.tech/# Pemain harus menetapkan batas saat bermain
RobertPieli
https://clmhealthpharm.shop/# buy cheap clomid prices
BrianSkace
where to get amoxicillin over the counter: generic amoxicillin cost – canadian pharmacy amoxicillin
BrandonStulp
rexall pharmacy amoxicillin 500mg: amoxicillin from canada – how to get amoxicillin over the counter
JustinDew
cost of generic zithromax: ZithroPharm – zithromax antibiotic
RobertPieli
https://doxhealthpharm.shop/# no prescription doxycycline
BrianSkace
can i buy amoxicillin over the counter in australia: Amo Health Pharm – amoxicillin 1000 mg capsule
BrandonStulp
how can i get clomid without rx: ClmHealthPharm – get cheap clomid price
VirgilTup
price of amoxicillin without insurance [url=http://amohealthpharm.com/#]amoxicillin 775 mg[/url] amoxicillin 775 mg
JustinDew
zithromax 500mg price: ZithroPharm – can i buy zithromax online
RobertPieli
https://clmhealthpharm.shop/# can i purchase generic clomid online
BrandonStulp
doxycycline cap price: doxycycline buy online usa – how to buy doxycycline online
BrianSkace
where can i buy zithromax in canada: buy zithromax without prescription online – zithromax 500 mg for sale
BrandonStulp
amoxicillin 500 mg without prescription: buy amoxicillin 500mg – amoxicillin buy canada
JustinDew
amoxicillin 50 mg tablets: amoxicillin 500mg tablets price in india – buying amoxicillin online
RobertPieli
https://clmhealthpharm.com/# where buy generic clomid
BrianSkace
where can i buy zithromax capsules: ZithroPharm – can you buy zithromax over the counter
BrandonStulp
doxycycline buy usa: pharmacy prices for doxycycline – doxycycline pills online
JustinDew
average cost of generic zithromax: where can i buy zithromax medicine – zithromax 500 mg lowest price pharmacy online
RobertPieli
https://doxhealthpharm.com/# buy doxycycline 100mg canada
BrianSkace
can you get clomid for sale: ClmHealthPharm – where to get clomid without dr prescription
BrandonStulp
zithromax 500mg: Zithro Pharm – zithromax capsules 250mg
JustinDew
can you buy generic clomid online: where can i buy generic clomid without a prescription – can you buy clomid for sale
RobertPieli
http://clmhealthpharm.com/# order generic clomid without rx
BrandonStulp
amoxicillin online purchase: AmoHealthPharm – can you buy amoxicillin uk
BrianSkace
where to purchase doxycycline: doxycycline australia – where to get doxycycline in singapore
VirgilTup
how can i get cheap clomid price [url=https://clmhealthpharm.com/#]ClmHealthPharm[/url] order cheap clomid for sale
BrandonStulp
amoxicillin over counter: Amo Health Pharm – cost of amoxicillin 875 mg
RobertPieli
http://clmhealthpharm.com/# can i purchase clomid no prescription
JustinDew
zithromax z-pak: Zithro Pharm – zithromax cost
BrianSkace
doxycycline 200mg price in india: Dox Health Pharm – doxycycline minocycline
BrandonStulp
can you get cheap clomid without insurance: ClmHealthPharm – clomid tablets
RobertPieli
https://amohealthpharm.com/# amoxicillin 500 mg where to buy
JustinDew
buy zithromax 500mg online: Zithro Pharm – zithromax prescription
VirgilTup
where to buy clomid prices [url=https://clmhealthpharm.shop/#]ClmHealthPharm[/url] can i buy clomid without prescription
RobertPieli
http://clmhealthpharm.com/# cost cheap clomid no prescription
JustinDew
zithromax 500 mg lowest price pharmacy online: ZithroPharm – zithromax cost australia
BrianSkace
generic zithromax medicine: ZithroPharm – zithromax 250 price
BrandonStulp
order clomid tablets: where buy cheap clomid no prescription – where buy clomid online
VirgilTup
buy doxycycline 100mg cheap [url=https://doxhealthpharm.shop/#]Dox Health Pharm[/url] doxycycline prescription australia
RobertPieli
https://amohealthpharm.shop/# amoxicillin 500mg price canada
BrianSkace
amoxicillin without prescription: amoxicillin 500mg – amoxicillin 500mg without prescription
BrandonStulp
purchase doxycycline online: doxycycline 50 medicine – doxycycline for sale over the counter
RobertPieli
http://doxhealthpharm.com/# cost doxycycline
JustinDew
can i purchase clomid tablets: ClmHealthPharm – cost of generic clomid
BrianSkace
where can i buy zithromax uk: buy generic zithromax online – buy zithromax online australia
VirgilTup
order amoxicillin online [url=https://amohealthpharm.shop/#]AmoHealthPharm[/url] can i buy amoxicillin over the counter
BrandonStulp
doxycycline over the counter south africa: can you buy doxycycline over the counter in nz – doxycycline cap 40mg
RobertPieli
http://amohealthpharm.com/# amoxicillin capsule 500mg price
BrianSkace
zithromax canadian pharmacy: how to get zithromax over the counter – zithromax 250
JustinDew
doxycycline 100 mg coupon: doxycycline 50mg – doxycycline 30
BrandonStulp
amoxicillin without a doctors prescription: buy amoxicillin without prescription – buy amoxicillin
RobertPieli
https://amohealthpharm.shop/# amoxicillin 500mg price canada
WilsonNibre
Viagra homme sans ordonnance belgique: Viagra pharmacie – Viagra homme prix en pharmacie sans ordonnance
Norbertviany
Viagra gГ©nГ©rique sans ordonnance en pharmacie: Viagra sans ordonnance livraison 48h – Viagra pas cher livraison rapide france
PerryResty
Viagra pas cher inde [url=https://viagrameilleurprix.com/#]Viagra sans ordonnance 24h[/url] Prix du Viagra en pharmacie en France
JacobTak
pharmacie en ligne france livraison belgique https://tadalafilmeilleurprix.com/# п»їpharmacie en ligne france
RichardGIG
http://kamagrameilleurprix.com/# Pharmacie en ligne livraison Europe
п»їpharmacie en ligne france
WilsonNibre
Viagra pas cher livraison rapide france: viagra sans ordonnance – Viagra pas cher livraison rapide france
Norbertviany
trouver un mГ©dicament en pharmacie: acheter mГ©dicament en ligne sans ordonnance – Pharmacie en ligne livraison Europe
JacobTak
pharmacie en ligne pas cher http://pharmaciemeilleurprix.com/# Pharmacie Internationale en ligne
RichardGIG
https://kamagrameilleurprix.com/# vente de mГ©dicament en ligne
pharmacie en ligne france livraison internationale
WilsonNibre
Pharmacie sans ordonnance: cialis sans ordonnance – pharmacie en ligne sans ordonnance
PerryResty
п»їpharmacie en ligne france [url=http://pharmaciemeilleurprix.com/#]pharmacie en ligne france[/url] pharmacie en ligne france livraison internationale
WilsonNibre
pharmacie en ligne avec ordonnance: kamagra gel – Achat mГ©dicament en ligne fiable
JacobTak
п»їpharmacie en ligne france https://kamagrameilleurprix.com/# pharmacie en ligne france pas cher
RichardGIG
http://viagrameilleurprix.com/# Viagra gГ©nГ©rique pas cher livraison rapide
pharmacie en ligne
WilsonNibre
Viagra vente libre allemagne: Acheter Viagra Cialis sans ordonnance – SildГ©nafil 100 mg prix en pharmacie en France
Norbertviany
Pharmacie sans ordonnance: kamagra en ligne – Pharmacie en ligne livraison Europe
JacobTak
pharmacie en ligne france livraison internationale https://pharmaciemeilleurprix.shop/# Pharmacie en ligne livraison Europe
RichardGIG
https://tadalafilmeilleurprix.com/# trouver un mГ©dicament en pharmacie
trouver un mГ©dicament en pharmacie
PerryResty
Pharmacie en ligne livraison Europe [url=https://kamagrameilleurprix.com/#]trouver un mГ©dicament en pharmacie[/url] pharmacie en ligne avec ordonnance
WilsonNibre
Pharmacie Internationale en ligne: achat kamagra – Achat mГ©dicament en ligne fiable
Norbertviany
Viagra vente libre pays: Viagra pharmacie – Viagra homme prix en pharmacie
JacobTak
pharmacie en ligne sans ordonnance https://kamagrameilleurprix.shop/# pharmacies en ligne certifiГ©es
WilsonNibre
SildГ©nafil 100 mg sans ordonnance: Viagra sans ordonnance 24h Amazon – Viagra pas cher livraison rapide france
WilsonNibre
vente de mГ©dicament en ligne: kamagra en ligne – acheter mГ©dicament en ligne sans ordonnance
PerryResty
trouver un mГ©dicament en pharmacie [url=https://pharmaciemeilleurprix.shop/#]pharmacie en ligne pas cher[/url] pharmacie en ligne sans ordonnance
JacobTak
pharmacie en ligne pas cher http://kamagrameilleurprix.com/# pharmacie en ligne sans ordonnance
RichardGIG
https://pharmaciemeilleurprix.shop/# п»їpharmacie en ligne france
Pharmacie en ligne livraison Europe
WilsonNibre
pharmacie en ligne france livraison internationale: kamagra oral jelly – pharmacie en ligne france pas cher
Norbertviany
Pharmacie en ligne livraison Europe: pharmacie en ligne – pharmacie en ligne france livraison belgique
JacobTak
pharmacie en ligne avec ordonnance https://viagrameilleurprix.com/# Viagra Pfizer sans ordonnance
WilsonNibre
pharmacie en ligne avec ordonnance: pharmacie en ligne pas cher – vente de mГ©dicament en ligne
RichardGIG
http://kamagrameilleurprix.com/# Pharmacie sans ordonnance
pharmacie en ligne france livraison internationale
Norbertviany
Sildenafil teva 100 mg sans ordonnance: Viagra sans ordonnance 24h – Le gГ©nГ©rique de Viagra
WilsonNibre
trouver un mГ©dicament en pharmacie: acheter kamagra site fiable – п»їpharmacie en ligne france
JacobTak
Pharmacie en ligne livraison Europe http://pharmaciemeilleurprix.com/# Pharmacie Internationale en ligne
RichardGIG
https://viagrameilleurprix.com/# Viagra pas cher inde
pharmacie en ligne avec ordonnance
Norbertviany
pharmacie en ligne fiable: Acheter Cialis – vente de mГ©dicament en ligne
JacobTak
Achat mГ©dicament en ligne fiable https://viagrameilleurprix.com/# Viagra en france livraison rapide
WilsonNibre
pharmacie en ligne france livraison belgique: kamagra livraison 24h – Pharmacie Internationale en ligne
RichardGIG
http://kamagrameilleurprix.com/# pharmacie en ligne fiable
pharmacie en ligne france livraison belgique
PerryResty
Viagra sans ordonnance 24h Amazon [url=https://viagrameilleurprix.shop/#]Viagra sans ordonnance 24h[/url] SildГ©nafil 100 mg prix en pharmacie en France
Norbertviany
pharmacie en ligne sans ordonnance: pharmacie en ligne france – pharmacie en ligne avec ordonnance
WilsonNibre
Acheter viagra en ligne livraison 24h: Viagra pharmacie – Viagra gГ©nГ©rique sans ordonnance en pharmacie